GOs: Cause & Effect, and Relevance
I am thankful to the colleague who introduced the fishbone chart to me. There are many ways to discuss cause and effect with students, and there are many forms of organization, but I like that with the fishbone chart you can easily include multiple points—related to not.
We were mid-unit when Covid-19 hit and in grade 8, we were just about to start preparing for a debate around who holds the most blame in terms of causing the First World War. My partner teacher and I were teaching the content together for the first time, we were trying this new summative assignment, and now our students are also in the midst of online learning. We quickly realized that we needed an additional scaffold to help students organize their points and situate themselves within their role for the assignment. That’s when someone in our department recommended using a fishbone chart.
Through using the fishbone, students were forced to think about the repercussions of the events and points they were using as evidence blaming their designated country. In order for the event to fit, they had to describe what happened, then outline the effect of those actions as well as how that influenced tensions between countries. In many discussions and sorting of evidence, teams were able to weed out the weakest arguments or points that didn’t actually help to prove that their country is guilty.
As an added benefit, when we set it up in the google classroom (using a google slide), we could easily monitor student progress during the lesson and join breakout rooms to discuss the points they chose to include.
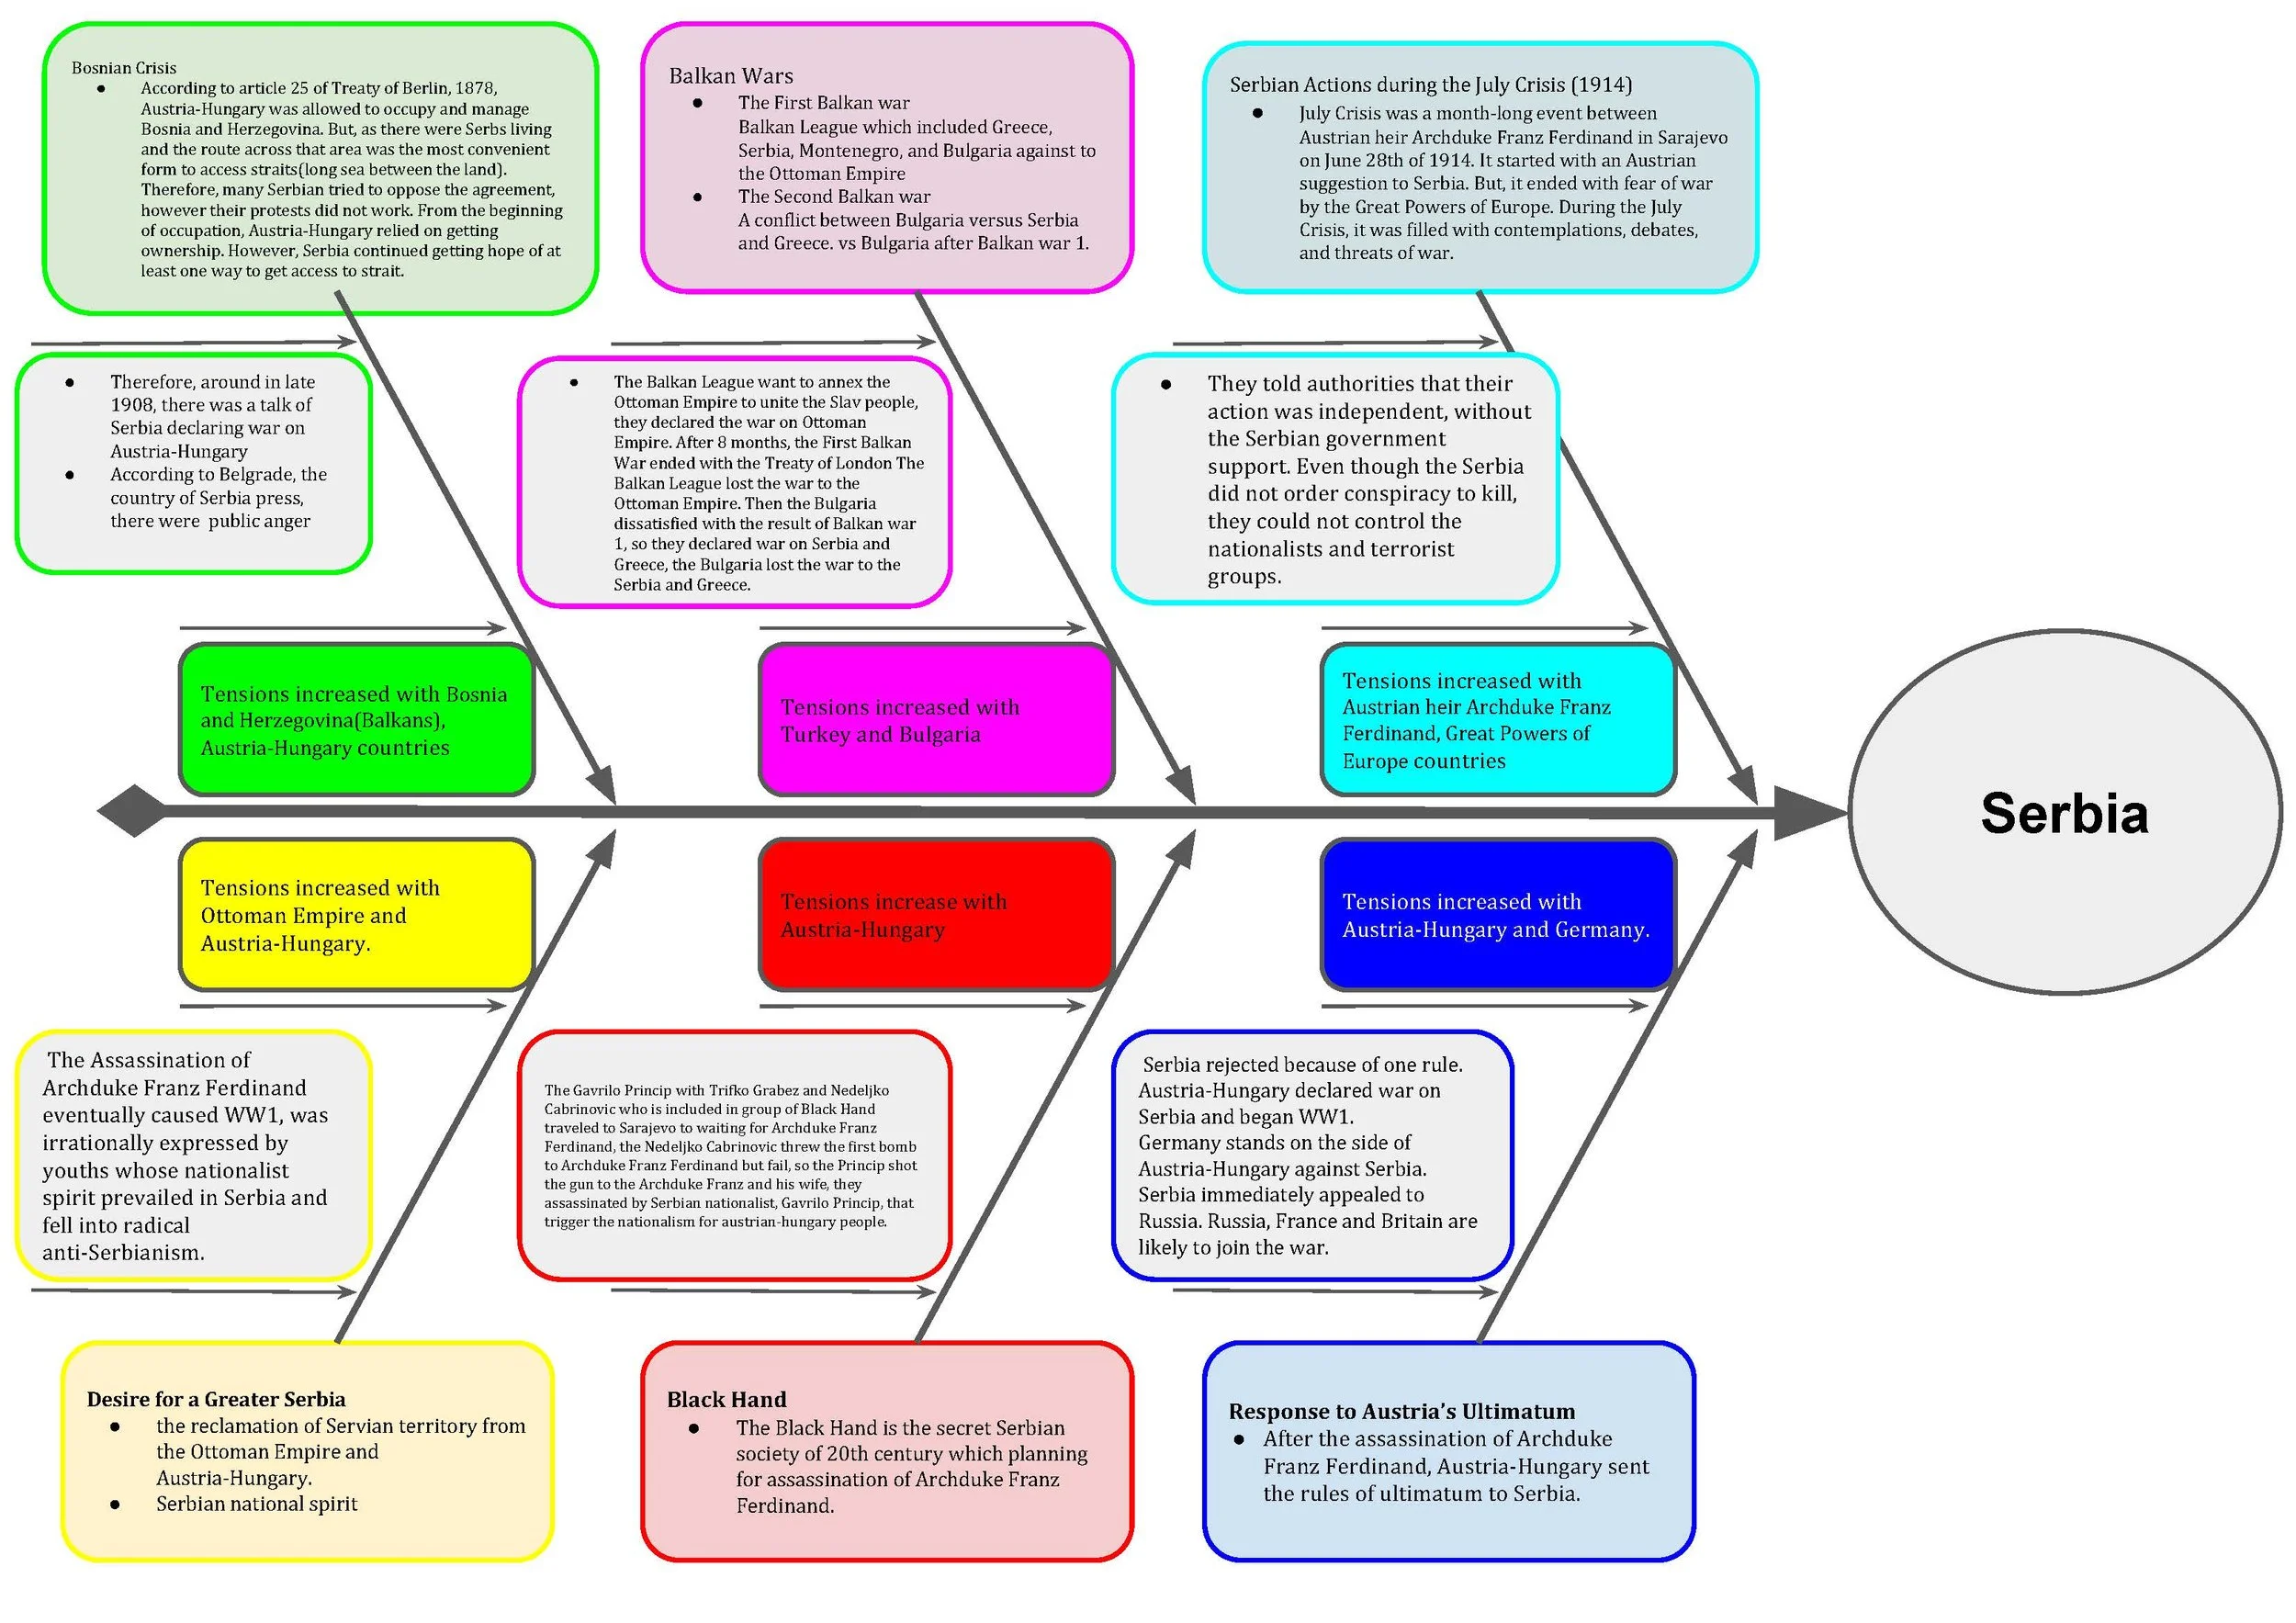
Sample fishbone chart blaming Serbia for the start of war.